


Fact Check: Peter Obi Didn’t Receive 44.5% and 15.2% in the North and South in the 2023 Election
Claim: Former National Chairman of the Inter-Party Advisory Council (IPAC), Peter Ameh, claimed that in the 2023 general election, Peter Obi secured 44.5% of votes in the South and 15.2% in the...

Claim: Former National Chairman of the Inter-Party Advisory Council (IPAC), Peter Ameh, claimed that in the 2023 general election, Peter Obi secured 44.5% of votes in the South and 15.2% in the North.
Verdict: False. Verified election results from INEC show that Peter Obi secured 43.0% from the South and 14.2% from the North
Full Story
In a video posted by ChannelsTelevision, via its X (formerly Twitter) account, reported on August 7th, 2025, that during Politics Today, a programme hosted by Seun Okinbaloye, the former IPAC Chairman, Peter Ameh, stated that Peter Obi received 44.5% of the votes in the South and 15.2% in the North in the 2023 general election.
Ameh, a known supporter of Peter Obi during the 2023 polls, stated: “It pains me today that we talk about North and South in the last election. 44.5% was what Peter Obi got in the South, and he got 15.2% in the North.”
This claim comes at a time when Peter Obi has publicly declared his intention to contest the 2027 presidential election, stating he would be willing to serve only a single four-year term if elected. This statement has sparked national debate among Nigerians.
The video has since gained significant traction online, with over 90 comments, 842 retweets, 2,100 likes, and 174,000 views.
NDR Fact Hub investigated this claim because political figures frequently make statements with data that are hard for the public to verify.
Verification
NDR Fact-hub reviewed the Independent National Electoral Commission’s (INEC) website for the official report of the 2023 general elections. INEC’s breakdown by geopolitical zones (including states and the FCT) shows the vote percentages per region but does not provide aggregated percentages for “North” and “South” as claimed.
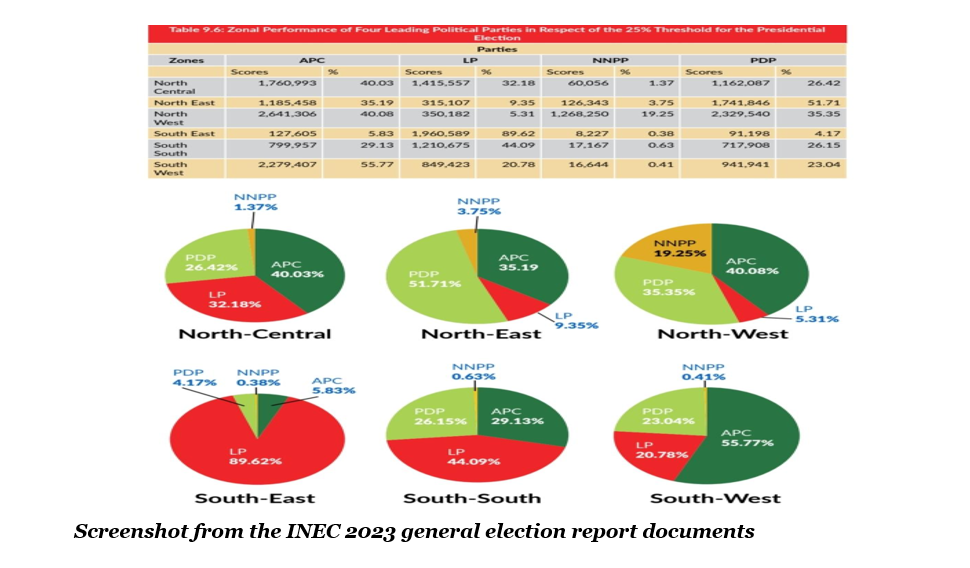 Since INEC’s public data did not directly provide totals for all political parties’ votes by the combined Northern and Southern regions, we used election result data compiled by Dataphyte from INEC’s collation centre. This dataset includes results for all political parties by state.
Our fact-checking team used Microsoft Excel to extract and total all valid votes cast for each political party in the 2023 presidential election, organising the results into Northern and Southern regions.
Presented below are the 2023 presidential election results, detailing the performance of each political party by state across both Northern and Southern regions. Additionally, the total number of votes cast for the Labour Party in all Northern and Southern areas is provided.
| NORTH CENTRAL | NORTH EAST | NORTH WEST | GRAND TOTAL |
| 4813 | 2337 | 2095 | |
| 3061 | 3448 | 3484 | |
| 2144 | 1843 | 2218 | |
| 15449 | 9912 | 10109 | |
| 9087 | 7603 | 11250 | |
| 1760993 | 1185458 | 2652235 | |
| 10806 | 8963 | 8026 | |
| 2803 | 3014 | 6717 | |
| 1712 | 1973 | 2250 | |
| 3475 | 1688 | 2126 | |
| 1415557 | 315107 | 350182 | |
| 60056 | 126343 | 1268250 | |
| 4027 | 5737 | 7738 | |
| 1162087 | 1741846 | 2329540 | |
| 53726 | 4373 | 9027 | |
| 33705 | 7603 | 3116 | |
| 4353 | 3401 | 15786 | |
| 16457 | 7090 | 6533 | |
| 4564311 | 3437739 | 6690682 | 14692732
|
Total of valid votes cast, results of political parties in the north central, east and west
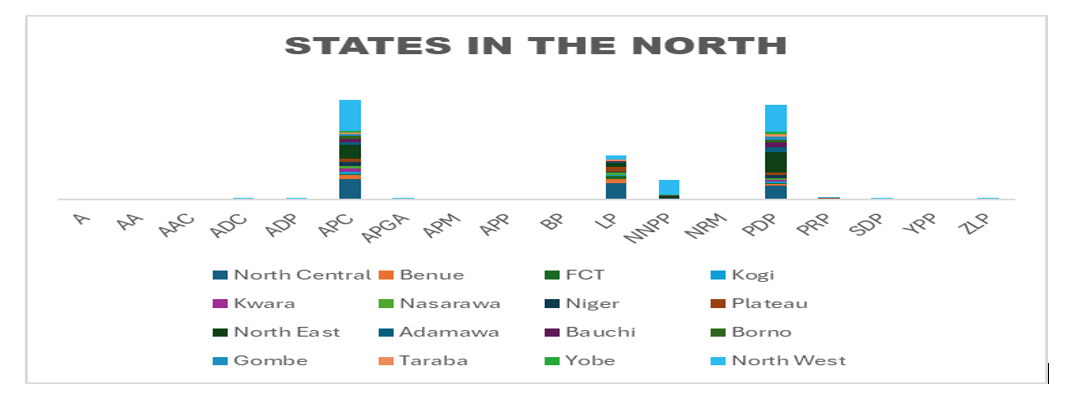
| NORTH CENTRAL | NORTH EAST | NORTH WEST | GRAND TOTAL | NORTH CENTRAL |
| 1415557 | 315107 | 350182 | 2080846 | 1415557 |
Labour Party total valid votes cast in the north central, east and west
| SOUTH EAST | SOUTH SOUTH | SOUTH WEST | GRAND TOTAL |
| 1510 | 5034 | 45225 | |
| 831 | 1411 | 2307 | |
| 910 | 2418 | 5073 | |
| 2259 | 10855 | 33335 | |
| 1333 | 4658 | 9973 | |
| 127605 | 799957 | 2279407 | |
| 19561 | 7905 | 6705 | |
| 2056 | 3532 | 7839 | |
| 1408 | 2339 | 3157 | |
| 2327 | 3514 | 3026 | |
| 1960589 | 1210675 | 849423 | |
| 8227 | 17167 | 16644 | |
| 1024 | 3432 | 2911 | |
| 91198 | 717908 | 941941 | |
| 481 | 2063 | 2474 | |
| 844 | 15443 | 19556 | |
| 4670 | 29575 | 2815 | |
| 6220 | 19754 | 21611 | |
| 2233053 | 2857640 | 4253422 | 934411 |
Total of valid votes cast, results of political parties in the south east, south, and west
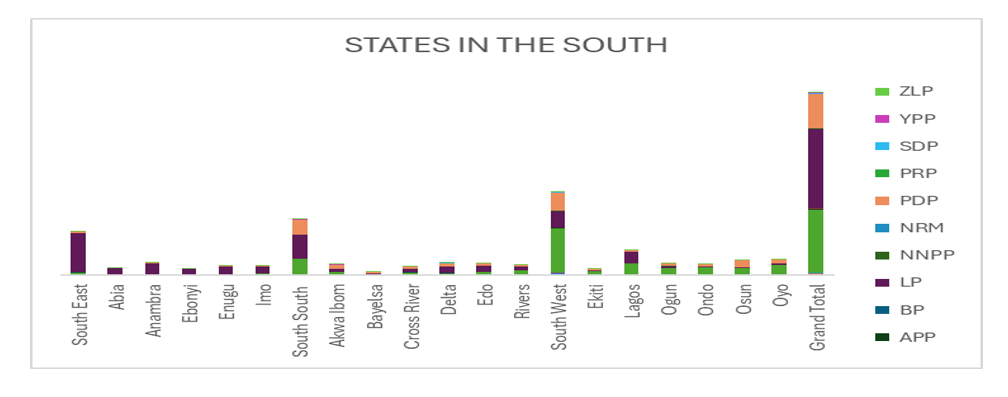
| SOUTH EAST | SOUTH SOUTH | SOUTH WEST | GRAND TOTAL |
| 1960589 | 1210675 | 849423 | 4020687 |
Labour Party total valid votes cast in the north east, south and west
Overall Total Percentage for All Northern Regions
We summed up Peter Obi’s votes from all northern sub-regions: 2,080,846, and the total valid votes from all northern sub-regions: 14,692,732.
2,080,846÷14,692,732=0.1416×100=14.2%
Peter Obi scored 14.2% across all states in the Northern region.
Overall Total Percentage for All Southern Region
We summed up Peter Obi’s votes from all southern sub-regions: 4,020,687, and the total valid votes from all southern sub-regions: 9,344,115.
4,020,687÷9,344,115=0.4303×100=43.0%
Peter Obi scored 43.0% across all southern regions.
Conclusion:
Peter Ameh’s claim is inaccurate. Verified election data indicate that Peter Obi received 43.0% of the votes in the South and 14.2% in the North, not 44.5% and 15.2% as previously reported.


